Call Center Project Report
- Tech Stack:Power BI, Power Query
- Github URL: click here
- Interactive Dashboard: click here
1. Introduction
Welcome to the Call Center data analysis report! In this project, I aimed to evaluate the call center's performance and monitor agent productivity. I aimed to assist the call center in making informed decisions and enhancing overall efficiency. This data-driven project uncovers valuable patterns, reveals managerial impact, and identifies the performance of every call agent.
2. Problem Statement
The Call Center seeks to optimize its operations and enhance call agent productivity. The key questions answered are:
- How well is the call center operating?
- What are the trends in total calls over time?
- How do individual managers and call agents contribute to call volumes?
- What are the top-performing and low-performing call agents?
3. Data Transformation
In preparation for analysis, I conducted a thorough data cleaning and transformation process using Power BI. The following steps were taken: Handling Missing Data: Advanced imputation techniques were employed to fill in missing values, ensuring the data was complete and reliable. Data Formatting: Date formats were standardized to ensure smooth integration into the visualizations, providing a coherent view of the timeline. Removing Duplicates: A comprehensive review of the dataset led to the elimination of duplicate records, ensuring data accuracy and avoiding any potential distortions.
4. Data Analysis and Visualization
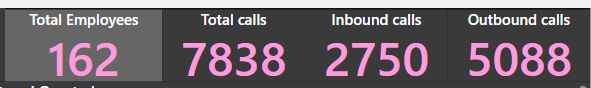
4.1 Total Call Center Overview
Let's begin by understanding the scale and reach of the Call Center:
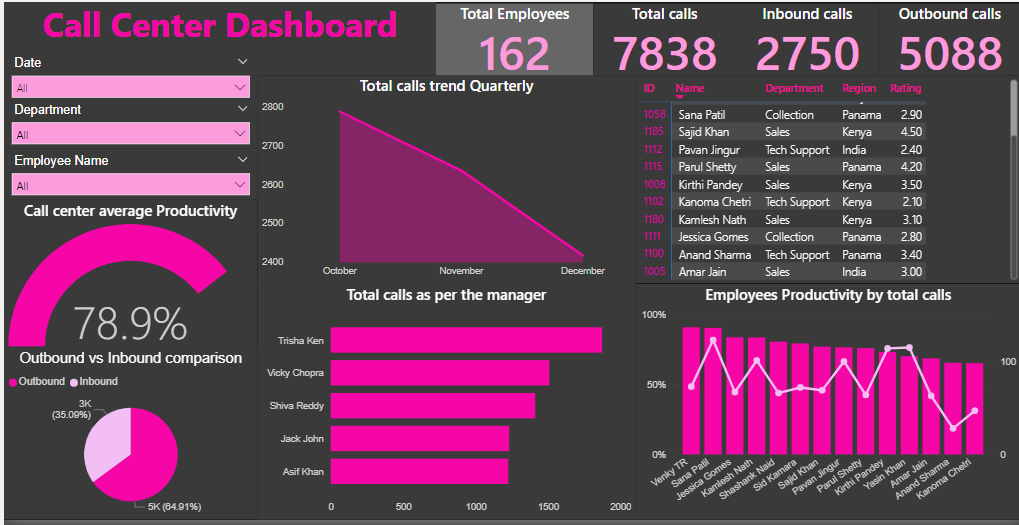
- Total Employees: 162
- Total Calls: 7,838
- Inbound Calls: 2,750
- Outbound Calls: 5,088
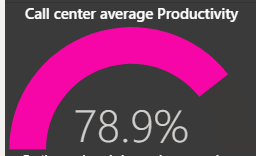
4.2 Call Center Productivity
Productivity is a critical metric that directly impacts customer satisfaction and operational efficiency:
- Average Productivity: 78.9%
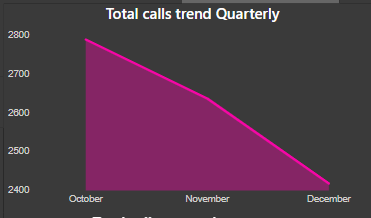
4.3 Call Trends Over Time
To monitor call center performance over time, I analyzed the trend in total calls from October to December. The results are depicted in the area chart below;
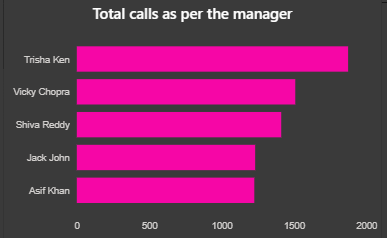
4.4 Call Performance by Managers
Understanding individual manager contributions to call volumes helps in strategic resource allocation. The stacked bar chart presents the total calls made by each manager.
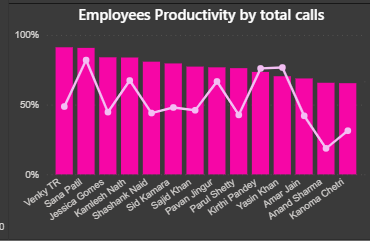
4.5 Employee Productivity Analysis
Identifying high-performing and low-performing agents is essential for optimizing the workforce. The chart below portrays employee productivity based on the total calls made.
4.6 Final Dashboard
Below is a brief description dashboard for the call center project:
5. Conclusions
Based on the data analysis, the following key insights are derived:
- The call center experienced a decline in total calls from October to December.
- Trisha Ken emerged as the top-performing manager, leading the team in call volumes.
- Sana Patii demonstrated exceptional productivity as the most productive agent.
- Anand Sharma's performance could benefit from improvement, as he ranked as the least productive.
6. Recommendations
To improve call center performance, following actions are suggested:
- Schedule Optimization: Align staff scheduling with call volume trends to ensure optimal resource allocation during peak periods.
- Training and Development: Provide additional training and support to agents with lower productivity to enhance their performance.
- Managerial Support: Offer guidance and coaching to managers to boost team performance and overall call center efficiency.