Customers Segmentation Report
- Tech Stack: R, Rmarkdown, K-means Algorithm
- Full markdown Report: Click here
- Github URL: Click here
1. Introduction
In today's competitive business landscape, understanding diverse customer needs is vital. Lacking insights hinders targeted marketing, customer satisfaction, and resource allocation. To address this, effective customer segmentation frameworks are essential. This report presents findings from a project aiming to identify distinct customer segments using advanced statistical techniques. Tailoring marketing efforts based on these segments can enhance understanding, drive informed decisions, and foster business growth in the dynamic market.
2. Problem Statement
Many companies struggle with understanding their diverse customer base, leading to the use of generic marketing strategies and suboptimal customer satisfaction. To address this challenge, this project focuses on developing an effective customer segmentation framework using the K-means clustering algorithm to identify and target specific customer groups with tailored marketing initiatives.
3. Data Wrangling and Preprocessing
The customer data was sourced from Kaggle and contained information on customer ID, gender, age, annual income, and spending score.
Before Analysis I perfomed the following tasks;
Handling Missing Values: Imputed the data points using the mean.
Removing Duplicates: Eliminated duplicate records to maintain data integrity.
Data Type Editing: Adjusted data types for consistency and accuracy. Encoded categorical variables and formatted numerical values.
I also performed some basic data summary statistics to gain insights into the age, annual income, and spending score distributions.
4. Data Analysis and Visualization
Various visualizations were used to gain insights into the customer data.
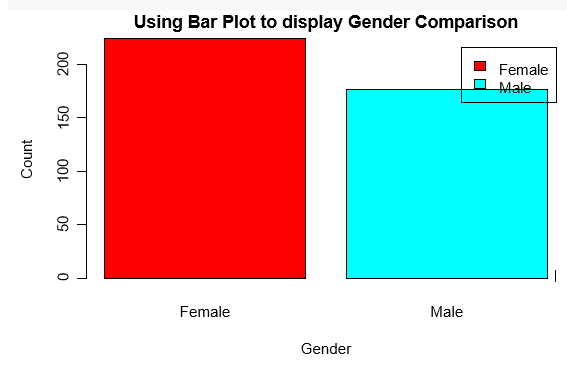
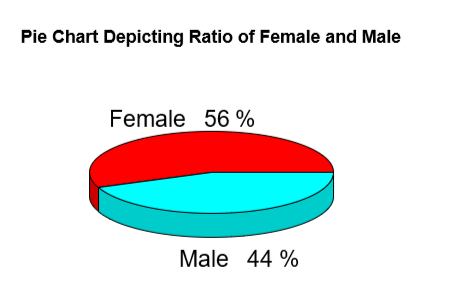
Firstly, I analyzed the gender distribution using bar plot and pie chart. It was observed that the majority of customers were females, accounting for 56% of the dataset.
Barplot
PieChart
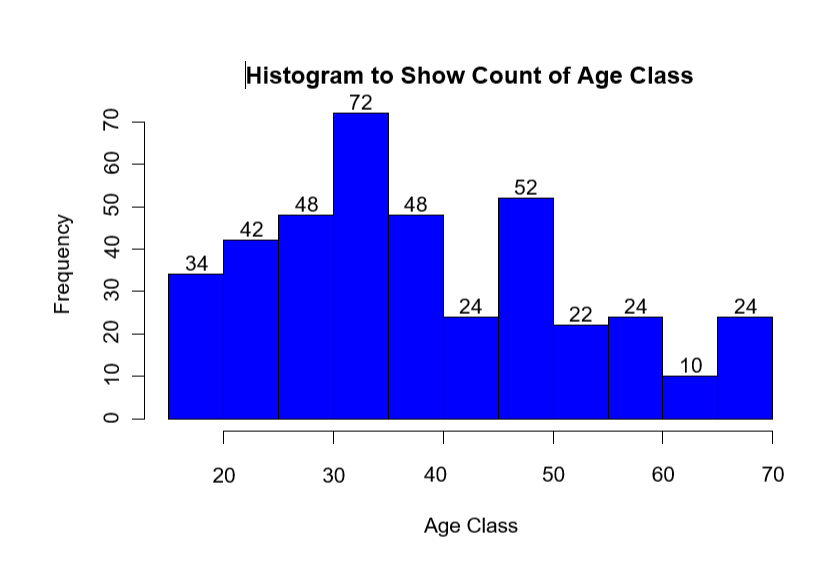
Next, I visualized the age distribution using a histogram. It revealed that the highest frequency of customers was between 30 and 35 years old.
Histogram for Age Distribution
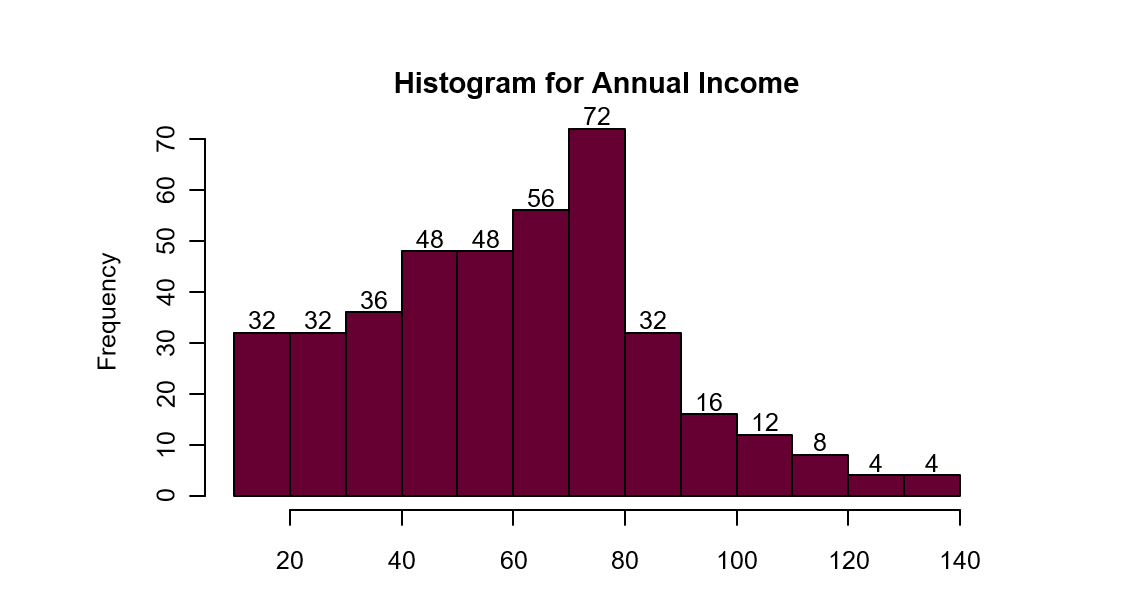
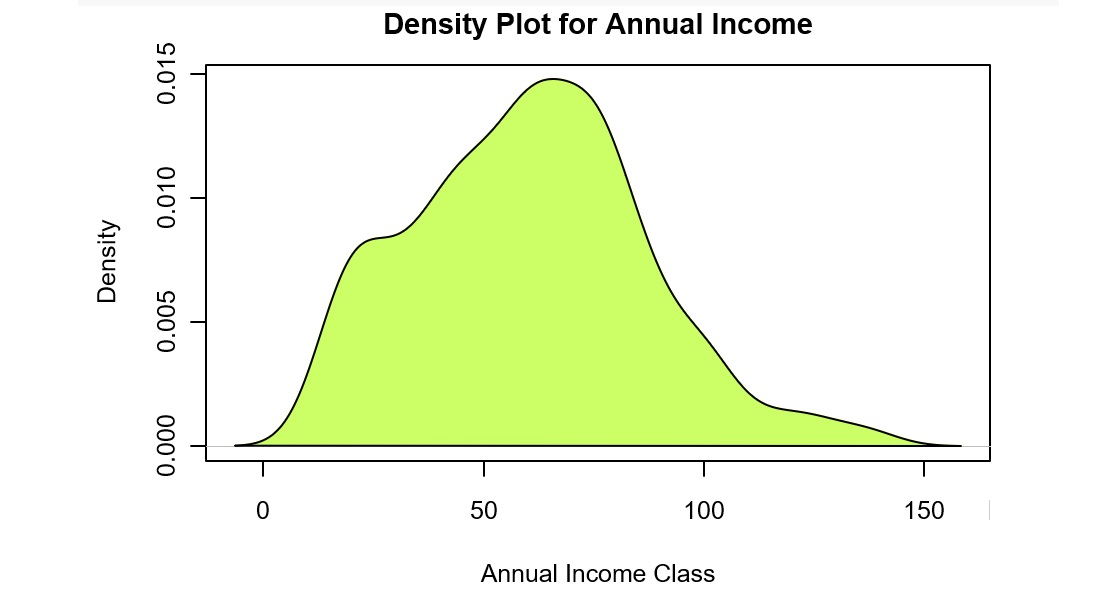
For the annual income analysis, I used a histogram and a density plot to understand the distribution. It was found that the average income of all customers in the dataset was approximately $60,560.
Histogram for Annual Income
Density Plot for Annual Income
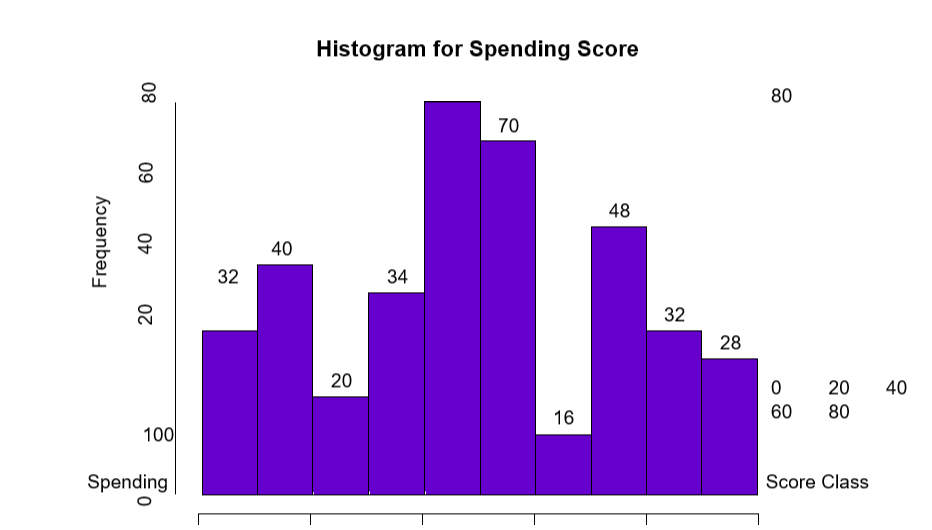
Lastly, I also used a histogram to analyze the spending score distribution, revealing that the majority of customers clustered around the median spending score of 50.00.
Histogram for Annual Expenditure
K-Means Algorithm
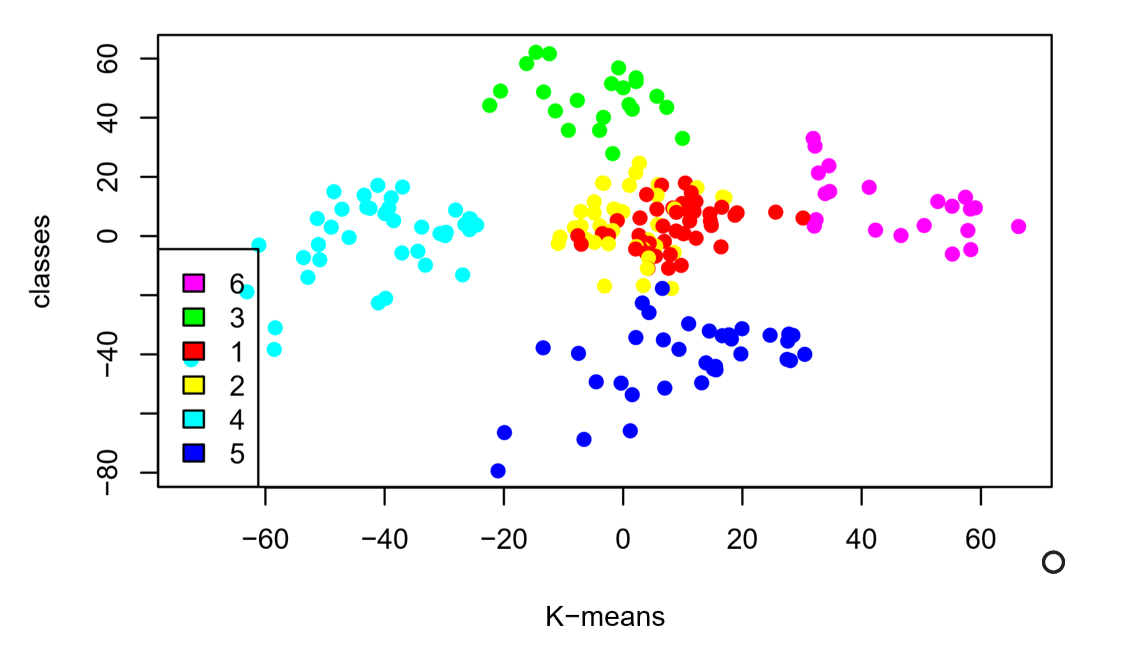
To segment the customers, I applied the K-means clustering algorithm. The optimal number of clusters was determined by evaluating the total intra-cluster sum of squares (ISS) and using silhouette plots. The K-means algorithm successfully created six distinct clusters, each with unique characteristics. NB: I have provided the silhouette plots in my rmarkdown report
To visualize the clustering results, I used principal component analysis (PCA) to reduce the dimensions of the data and plot the clusters in a 2D space. The visualization showed how the customers were grouped into six clusters based on their income and spending patterns.
5. Conclusions
The customer segmentation project demonstrated the effectiveness of using the K-means clustering algorithm to divide the customer base into distinct groups based on income and spending patterns. By understanding customer segments, businesses can implement targeted marketing strategies and make more informed decisions.
6. Recommendations
- Continuously Monitor and Update Segmentation: Customer preferences and behaviors evolve over time, so it's essential to regularly reevaluate the customer segmentation framework. Keep track of changing trends and adjust the segmentation criteria to stay relevant and effective in targeting customer needs.
- Personalize Marketing Strategies: Tailor marketing initiatives for each customer segment based on their distinct characteristics and preferences. Utilize data-driven insights to create personalized offers, promotions, and communication channels that resonate with different customer groups.
- Customer Feedback and Surveys: Regularly collect customer feedback and conduct surveys to understand their needs, expectations, and satisfaction levels. This direct input from customers provides valuable insights for refining the segmentation approach and enhancing overall customer experience.
- Customer Retention Strategies: Develop targeted customer retention strategies for high-value segments to reduce churn and increase loyalty. Engaging loyal customers with exclusive offers and rewards can foster long-term relationships.